Performance Profiling
Catalyst Profiler combines browser, WebView, bridge, native, cache, render, and memory signals into one debugging workflow for universal apps.
Profiling is disabled by default and is intended for debug builds only.
Enable Profiling
Add profiler.enabled under WEBVIEW_CONFIG:
{
  "WEBVIEW_CONFIG": {
    "profiler": {
      "enabled": true
    },
    "android": {
      "buildType": "debug"
    },
    "ios": {
      "buildType": "Debug"
    }
  }
}
Rebuild the native app after changing this value. The profiler is hard-disabled in Android release builds and iOS non-debug builds, even if the config value is true.
Initialize the native bridge in the Catalyst app before using the profiler API:
import WebBridge from "catalyst-core/WebBridge"

WebBridge.init()
The profiler is exposed as window.CatalystPerf after the bridge initializes.
Android: Chrome DevTools
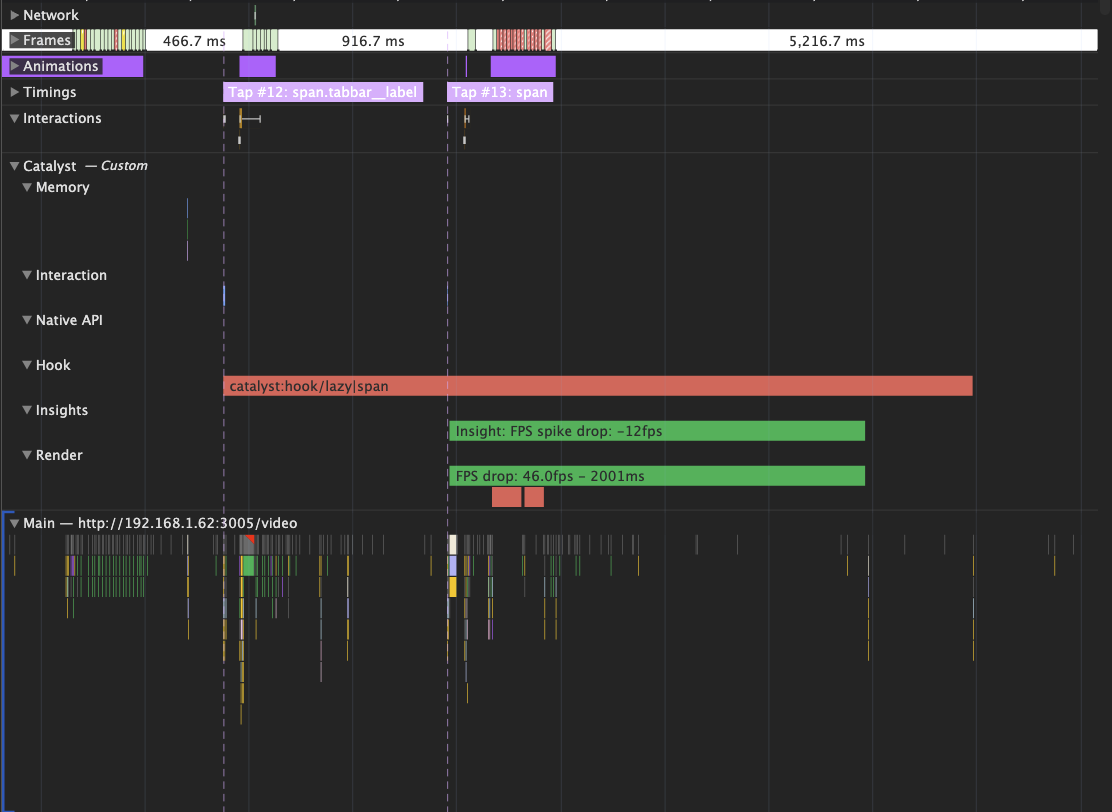
Android provides the complete combined view: Chrome’s browser tracks and Catalyst’s custom tracks appear in the same Performance recording.
- Start the Catalyst app with profiling enabled.
- Open
chrome://inspectin Chrome and inspect the running WebView. - Open the Performance panel and start recording.
- Use the app: navigate between routes, trigger native APIs, load data, scroll, and use the keyboard.
- Stop the recording and expand the Catalyst track group.
Catalyst emits tracks for navigation, input, render, memory, cache, network, native API execution, hooks, interaction, and insights. Click a span to see its properties, including durations, IDs, and related interaction IDs.
iOS: Safari and Trace Export
Safari does not provide the Chrome custom-track extension surface. Use Safari Web Inspector to inspect browser activity and the Catalyst runtime API to inspect or export Catalyst data.
- Start the iOS app with profiling enabled.
- Open Safari Develop and inspect the running WebView.
- Use the Console or Timelines tools while exercising the app.
- Query Catalyst data with
window.CatalystPerf. - Export a Chrome Trace file with
window.CatalystPerf.downloadTrace()and import the resulting JSON into a compatible trace viewer.
On iOS, downloadTrace() writes the trace to the app’s documents area and presents the native sharing sheet. Choose an available file-sharing destination. In a regular browser context, it downloads the JSON through the browser instead.
What Is Captured
| Area | Signals |
|---|---|
| Startup and navigation | Cold start, WebView boot, page loads, page-load errors, route transitions, FCP, and LCP |
| Interaction and input | Tap-to-next-frame response, long press, scroll sessions, keyboard sessions, and viewport resize |
| Network and cache | fetch, XHR, memory-cache hits, disk-cache hits, cache misses, network fetches, and cache summaries |
| Native APIs | Immediate native handler execution, method, call ID, and native thread. This excludes JS transport, callback delivery, and UI completion. |
| Rendering | FPS-drop episodes, long tasks, long animation frames, layout shifts, and hardware-acceleration changes |
| Memory | Android JVM, WebView/native, and total process memory; iOS process memory snapshots |
| Insights | Threshold-based findings for slow loads, interactions, FPS drops, memory, cache hit rate, and render issues |
Native timestamps are aligned to the browser’s performance.now() timeline, so browser and Catalyst events can be compared directly.
Console API
The stable public API is exposed as window.CatalystPerf when profiling is enabled.
Read the Store
window.CatalystPerf.version
window.CatalystPerf.store()
window.CatalystPerf.events()
window.CatalystPerf.requests()
window.CatalystPerf.sessions()
window.CatalystPerf.metrics()
window.CatalystPerf.insights()
store() returns the complete normalized snapshot:
{
  version,
  createdAt,
  events,
  requests,
  sessions,
  metrics,
  insights
}
The store is in memory and each collection is capped at 5,000 records. memory-snapshot data is represented in metrics and is not duplicated in the general events collection.
Analyze the Recording
window.CatalystPerf.summary()
window.CatalystPerf.waterfalls()
window.CatalystPerf.waterfall("interactions")
summary() returns counts, slowest interactions and requests, render issues, memory information, interaction breakdowns, and findings.
Available waterfall types:
page-load, navigation, requests, native-api, interactions,
render-jank, scroll, keyboard, cache, memory, all
Waterfalls are grouped views that connect related work. For example, the interaction waterfall groups a tap with overlapping network, native API, render, and insight records.
Export or Reset
window.CatalystPerf.trace()
window.CatalystPerf.downloadTrace()
window.CatalystPerf.export()
window.CatalystPerf.clear()
trace()returns a JSON string in Chrome Trace Event format.downloadTrace(filename?)exports a Chrome Trace JSON file. The filename is optional.export()returns the normalized store snapshot and does not create a file.clear()removes all stored records and resets in-progress correlations.
Use downloadTrace() when a file is required. Use export() or the collection methods when inspecting data in the console.
Reading Insights
Insights are point-in-time findings emitted on the Catalyst > Insights track and returned by insights() and summary().findings.
Each insight includes:
severity:critical,warning, orinforule: machine-readable finding IDmessage: diagnosis of the observed problemfix: suggested next investigation or actiondetail: evidence and correlation IDs
Start with a critical insight, then inspect the related track and use its interactionId, callId, requestId, or memoryId to connect the finding to the underlying records.
Limitations
- The profiler is diagnostic instrumentation, not production telemetry. Keep it disabled for release builds.
- The browser’s own Performance recording is not included in
CatalystPerf.export();export()contains Catalyst’s normalized data only. - On Android, use Chrome DevTools for the combined browser + Catalyst timeline.
downloadTrace()is not the Android recording workflow. - On iOS, Safari’s native browser timeline and the exported Catalyst trace are separate files/views; the trace export does not merge Safari’s internal timeline data.